Since the 1970s, global warming has really picked up speed, driven by humans, explains Ulrich Foelsche, head of the Institute of Physics at the University of Graz. Before that, atmospheric warming stagnated due to heavy air pollution - the concentrated sulphur aerosols acted as a kind of protective screen against solar radiation. "In particular, the clear increase of two degrees since about 1980 is striking. The increase in summer temperatures is even more impressive - here it is even three degrees!", Foelsche summarises. It is precisely the hottest average annual temperatures that have been accumulating in recent years. Even if a year is comparatively cooler, it usually has more heat days than before - the temperature extremes are increasing, the physicist continues. Because humans have such a strong influence on the Earth, scientists today often speak of the geochronological epoch of the Anthropocene (from the ancient Greek ánthropos "man").
Geoengineering as a solution?
The physicist attributes the longer and more extreme cold periods to global phenomena. For example, the Indonesian Tambora volcano erupted in 1815 as the largest eruption observed in historical times. The ash cloud was dispersed across the world by high-altitude winds in the stratosphere, Foelsche explains: "In this case, sulphuric acid droplets formed a parasol that led to crop failures and famine all over the world in the 'year without a summer', 1816." In Geoengineering scientists attempt to replicate such historical effects and thereby deliberately alter the climate system. Can this be a way out of the climate crisis? The physicist is very sceptical: "There are ideas, but the practical implementation of geoengineering - especially solar radiation management - is difficult because such techniques can have devastating and unforeseeable side effects on the global weather. Conventional methods like CO2 reduction through tree planting is definitely safer."
Everybody can participate
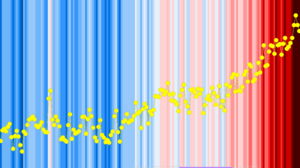
Under the motto #ShowYourStripes, anyone can take part in the University of Reading's initiative and display the warming stripes of their own country and place on the website, as long as they are included in the data. Although the Warming Stripes are a good visualisation to illustrate global warming, the representation also has its weaknesses: "You can see the progress well, but the temperature of the individual years does not show well, I would prefer a graphic in which this is included", summarises the scientist (see below).
Back to Graz: The data on which the warming stripes of the University of Graz are based come from the weather station of the University of Graz, but can be applied to a larger area, for example Austria. The global warming stripes look similar, but there are fewer spikes of individual years, as you can see in the image below, it is more of a continuous progression from blue to red.